


Home / Articles / AI & Analytics
The Real ROI of AI: Measuring Business Impact Beyond Automation
Most manufacturers measure AI ROI in hours saved. See the four-layer framework for measuring real AI ROI in manufacturing, beyond simple automation metrics.
By DevWorks Automation Team · August 27, 2026 · 13 min read

Ask most manufacturers how they measure AI ROI and you'll get the same answer: hours saved, headcount avoided, tasks automated. It's a reasonable place to start, and it's also where most ROI conversations stop. That's a problem, because it's not where most of the value shows up.
Automation-hours-saved is real, but it's the shallowest layer of what AI actually returns to a manufacturing business. The deeper value (fewer late orders, better quoting decisions, engineering that doesn't re-do the same mistake three times a quarter, a planner who catches a scheduling conflict four days earlier) rarely appears in a task-automation spreadsheet. It shows up in on-time delivery rates, quote-to-close ratios, scrap percentages, and how fast your team makes a good call under pressure. If you're only counting automated hours, you're measuring the smallest fraction of what you're actually getting.
This post lays out a framework for measuring AI ROI that goes beyond automation math, built specifically for manufacturing and engineering-driven businesses, where the biggest returns often come from decisions, not tasks.
If you're still working out which workflows are worth automating in the first place, our related post on 5 signs your manufacturing workflows are ready for automation is a good place to start before you get into the ROI math below.
Why "Automation ROI" Undercounts the Real Value of AI
Traditional automation ROI follows a simple formula: take a manual task, measure how long it takes a person, multiply by how many times it happens, subtract the cost of the tool. It works well for RPA-style projects (data entry, file transfers, report generation) because the task before and after AI is functionally the same task, just faster.
AI breaks that model in two ways.
First, AI doesn't just do the task faster. It often does a different and better version of the task. A predictive model that flags an at-risk order isn't automating "checking order status"; it's creating a capability that didn't exist before: seeing a problem before it happens. There's no manual-hours baseline to compare that against, because no one was doing it manually.
Second, AI's value compounds and cascades in ways a single automated task doesn't. When a machine learning model predicts a late order five days out instead of the day it ships, that single prediction can avoid expedited freight, protect a customer relationship, free up a planner's afternoon, and prevent the downstream schedule disruption that would have bumped two other jobs. One prediction, four or five points of value, most of which never gets tagged as "AI ROI" because it happened in someone else's department.
If your measurement stops at "hours automated," you are structurally blind to both of these effects. You need a framework that captures value where it actually lands.
The Four Layers of AI ROI in Manufacturing
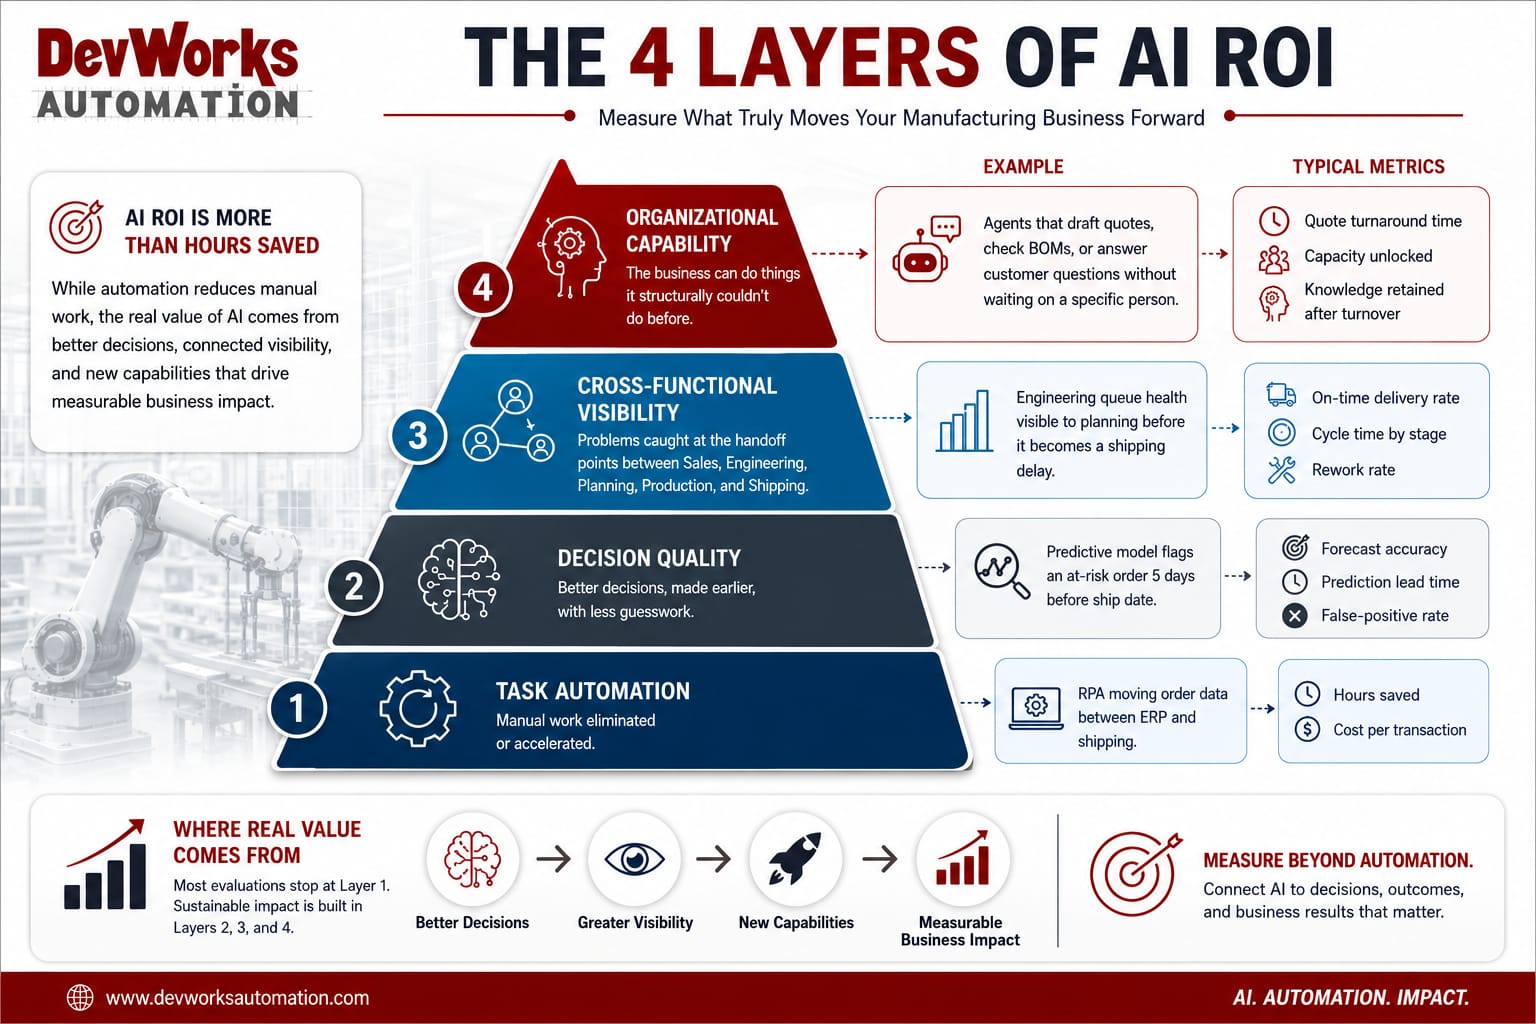
We think about AI value in four layers. Each layer is real, each is measurable, and each requires a different kind of metric. Most manufacturers only measure Layer 1.
| Layer | What it captures | Example | Typical metric |
|---|---|---|---|
| 1. Task Automation | Manual work eliminated or accelerated | RPA moving order data between ERP and shipping | Hours saved, cost per transaction |
| 2. Decision Quality | Better decisions, made earlier, with less guesswork | Predictive model flags an at-risk order 5 days before ship date | Forecast accuracy, prediction lead time, false-positive rate |
| 3. Cross-Functional Visibility | Problems caught at the handoff points between Sales, Engineering, Planning, Production, and Shipping | Engineering queue health visible to planning before it becomes a shipping delay | On-time delivery rate, cycle time by stage, rework rate |
| 4. Organizational Capability | The business can do things it structurally couldn't do before | Agents that draft quotes, check BOMs, or answer customer questions without waiting on a specific person | Quote turnaround time, capacity unlocked, knowledge retained after turnover |
Layer 1 is where most AI evaluations begin and end. Layers 2 through 4 are where manufacturing businesses actually change their trajectory, and where DevWorks Automation focuses most of our engineering and analytics work, because that's where the compounding returns live.
For a closer look at how this plays out in practice, see our related post on how AI predicts late orders before they happen in manufacturing.
Hard ROI vs. Soft ROI: Track Both, Report Them Separately
Inside those four layers, every metric falls into one of two buckets: hard ROI and soft ROI. Both matter. The mistake is blending them into one number, because a strong soft-ROI story can quietly cover for the absence of hard financial return, and eventually, someone in finance will notice.
Hard ROI is the dollar-denominated, board-defensible number:
- Reduced expediting and freight costs from earlier problem detection
- Labor hours redeployed from manual monitoring to higher-value work
- Scrap and rework reduction from catching quality drift earlier
- Inventory carrying-cost reduction from better demand and lead-time forecasting
- Faster quote-to-cash cycle time, translated into working capital impact
Soft ROI is the leading-indicator layer: harder to put a dollar figure on immediately, but predictive of whether the hard ROI is coming:
- Forecast and prediction accuracy trending upward as models see more data
- Adoption rate: what percentage of planners, engineers, and supervisors actually use the tool day to day
- Time-to-decision: how much faster a planner or engineer can make a confident call
- Employee sentiment toward the tool: a dashboard nobody trusts gets ignored, no matter how accurate it is
- Knowledge retention: how much operational judgment is now captured in a system instead of living only in one person's head
Report both, but don't let soft ROI stand in for hard ROI past the first two or three quarters. Soft metrics tell you whether the initiative is on track. Hard metrics tell you whether it paid for itself.
A Practical Measurement Framework You Can Use This Quarter
You don't need a data science team or a six-month measurement project to start doing this properly. Four steps will get most manufacturers a credible ROI picture within a quarter.
- Baseline before you build: Pull 6 to 12 months of historical data on the metric you're targeting (on-time delivery rate, quote turnaround, scrap rate, engineering cycle time) before the AI tool goes live. Without a real baseline, every result afterward is a guess dressed up as a number.
- Pick one leading indicator and one lagging indicator per initiative: Leading indicators (prediction accuracy, adoption rate, forecast lead time) tell you early if the model is working. Lagging indicators (on-time delivery %, expediting cost, scrap %) tell you if it paid off. Track both from day one, not just the lagging one at quarter-end.
- Tie at least one metric directly to a P&L line: Expediting cost, overtime hours, scrap dollars, or carrying cost: something finance already tracks. This is what turns "the team likes the dashboard" into a number a CFO will defend in a budget meeting.
- Review on a fixed cadence, not just at renewal time: Monthly for the first two quarters, then quarterly. AI models drift, adoption fades if no one checks in, and the biggest ROI failures we see aren't bad models. They're good models nobody kept measuring.
Which Metrics to Track, by AI Initiative
Different AI initiatives create value in different places, so the leading and lagging KPIs you track should change with the initiative. Here's a starting point for six common manufacturing use cases:
| AI Initiative | Leading KPI | Lagging KPI | Financial Impact |
|---|---|---|---|
| Predictive Maintenance | Prediction accuracy | Unplanned downtime | Avoided downtime cost |
| Quality AI | Detection accuracy | Scrap and rework rate | Material and labor savings |
| Demand Forecasting | Forecast accuracy | Inventory turnover | Reduced carrying cost |
| Late-Order Prediction | Prediction lead time | On-time delivery rate | Reduced expediting cost |
| AI-Powered Quoting | Adoption rate | Quote turnaround time | Increased capacity and revenue |
| Production Scheduling AI | Recommendation acceptance rate | Schedule adherence | Improved capacity utilization |
The point isn't to track every metric in this table at once. Pick the row that matches your initiative, and use it as the starting pair before you build out anything more elaborate, or work with our AI consulting services team to tailor one to your operation.
Putting a Number on It: A Worked Example
The framework is only useful if you can turn it into a real calculation, so here's what it looks like end to end.
The basic formula:
AI ROI (%) = (Annual Business Value − Total AI Investment) ÷ Total AI Investment × 100
Say a manufacturer spends roughly $180,000 a year on expedited freight caused by late-order situations. A late-order prediction model gives planners enough lead time to intervene before a shipment is at risk, and over a year it reduces that expediting spend by 25%.
Annual business value: $180,000 × 25% = $45,000
If the AI initiative (software, integration, and ongoing model monitoring) costs $30,000 a year:
AI ROI = ($45,000 − $30,000) ÷ $30,000 × 100 = 50%
That number is defensible in a budget meeting because it's tied to a real, pre-existing cost line, not a projection. It also doesn't need to include the softer benefits, like happier customers or a less frantic planning team, to justify the investment on its own. Those benefits are real, but they belong in the soft-ROI column, not folded into the headline number. For examples of what this looks like with real client numbers, see our case studies.
Where Manufacturers Get This Wrong
A few patterns show up repeatedly when AI ROI conversations stall or get abandoned:
- Measuring the tool, not the workflow: A model with 90% prediction accuracy that nobody acts on has 0% business impact. Measure the decision and the action it triggered, not just the model's output.
- No baseline, so no real comparison: Without a documented "before" state, any improvement claim is unfalsifiable, and unfalsifiable ROI claims are the fastest way to lose executive trust in the program.
- Judging Year One like it's the steady state: AI value in manufacturing is often slow for the first two to three quarters and accelerates as models see more seasons of data and adoption climbs. Projects get killed at month four that would have paid off at month ten.
- Ignoring the handoffs: The costliest problems in manufacturing (late orders, quoting errors, quality escapes) usually originate at the handoff between departments, not inside one. If your AI initiative only touches one team's workflow, you're capping your own ROI before you start.
- Best-case business cases: If a pilot suggests a 30% improvement is possible, model 15% in the business case. Add a buffer for the integration, data cleanup, and change management costs that never make it into the initial quote.
What This Looks Like in Practice
At DevWorks Automation, this is exactly the shape of the analytics and AI work we build for manufacturing and engineering-driven clients. A predictive model that flags at-risk orders before they miss a ship date isn't valuable because it's clever. It's valuable because it changes a planner's decision five days earlier than they'd otherwise have made it, which shows up later as fewer expedited shipments and a better on-time delivery number. An agentic AI workflow that drafts a first-pass quote or checks a BOM against engineering rules isn't valuable because it's automated. It's valuable because it frees an engineer to spend that hour on the parts of the job only they can do, and because that judgment stays available even when the one person who used to hold it in their head is out sick or moves on.
That's the pattern across the four layers: the automation is the visible part, but the decision quality, the cross-functional visibility, and the capability the business now has are where the return compounds. It's also part of a broader shift across the industry, one where manufacturers compete on tailored technology and cross-functional visibility rather than subscription overhead alone, a trend we cover in The U.S. Manufacturing Comeback.
AI ROI Measurement Checklist
Before calling an AI initiative a success, you should be able to check off every item below:
- What business problem is this initiative actually solving?
- What was the baseline before implementation?
- Which leading KPI shows the model is working?
- Which lagging KPI shows it's paying off?
- Which one metric ties directly to a financial line?
- Are the people who need to use it actually using it?
- Are the AI's outputs changing real decisions and actions?
- Is there a measurable benefit at the cross-functional handoffs?
- Are results being compared against the original business case, not just praised in the abstract?
- Is this being reviewed on a fixed schedule, or only when the contract is up for renewal?
Where to Start
You don't need to overhaul your measurement approach overnight. Pick one initiative already in flight (a predictive maintenance model, a lateness-prediction dashboard, an early agentic AI pilot) and apply this framework to it this quarter: document the baseline, pick one leading and one lagging metric, tie one number to the P&L, and put a review date on the calendar.
DevWorks Automation designs and implements the data infrastructure, predictive models, and AI agents that connect Sales, Engineering, Planning, Production, and Shipping into one measurable system, not just individually automated tasks. If you want help building the baseline and the measurement framework alongside the AI itself get in touch. That's exactly where we start every engagement.
Frequently Asked Questions
What's the difference between AI ROI and automation ROI in manufacturing?
Automation ROI measures time and cost saved on a specific task. AI ROI is broader: it also captures the value of better and earlier decisions, visibility across departmental handoffs, and new organizational capabilities, which don't show up in a simple hours-saved calculation.
How long does it take to see real ROI from AI in manufacturing?
Most manufacturers see meaningful hard ROI within two to three quarters. The first two to three months are typically slower, as models are trained on real operational data and teams build trust in the outputs. Judging an AI initiative purely on its first-quarter numbers is one of the most common reasons manufacturers abandon programs that would have paid off.
What metrics should manufacturers track for AI ROI beyond hours saved?
On-time delivery rate, prediction lead time, forecast accuracy, scrap and rework rate, quote turnaround time, expediting and freight cost, adoption rate, and cycle time at cross-functional handoff points (engineering-to-planning, planning-to-production, and so on).
How do you prove AI ROI to a CFO?
Connect the initiative to a financial line the CFO already watches, such as expediting cost or scrap dollars. Establish a baseline before deployment, measure actual performance after, and report the difference. A single defensible number tied to an existing P&L line will carry more weight than a broad set of dashboard metrics.
What's a good ROI target for an AI project?
There's no single percentage that applies across every project. What counts as a good return depends on implementation cost, the size of the problem being solved, payback expectations, and how much strategic or revenue upside the initiative carries beyond the direct cost savings. Use a conservative, baseline-driven calculation rather than benchmarking against a generic industry number.